CVP Telemetry and Introduction to Dashboards (Advanced Change Control Lab Pt. 2)
Viewing Telemetry
Note
Please complete the Advanced Change Control Lab first in order to see the additional IPv4 routes shown below. --Click here to go back to part 1 of this lab
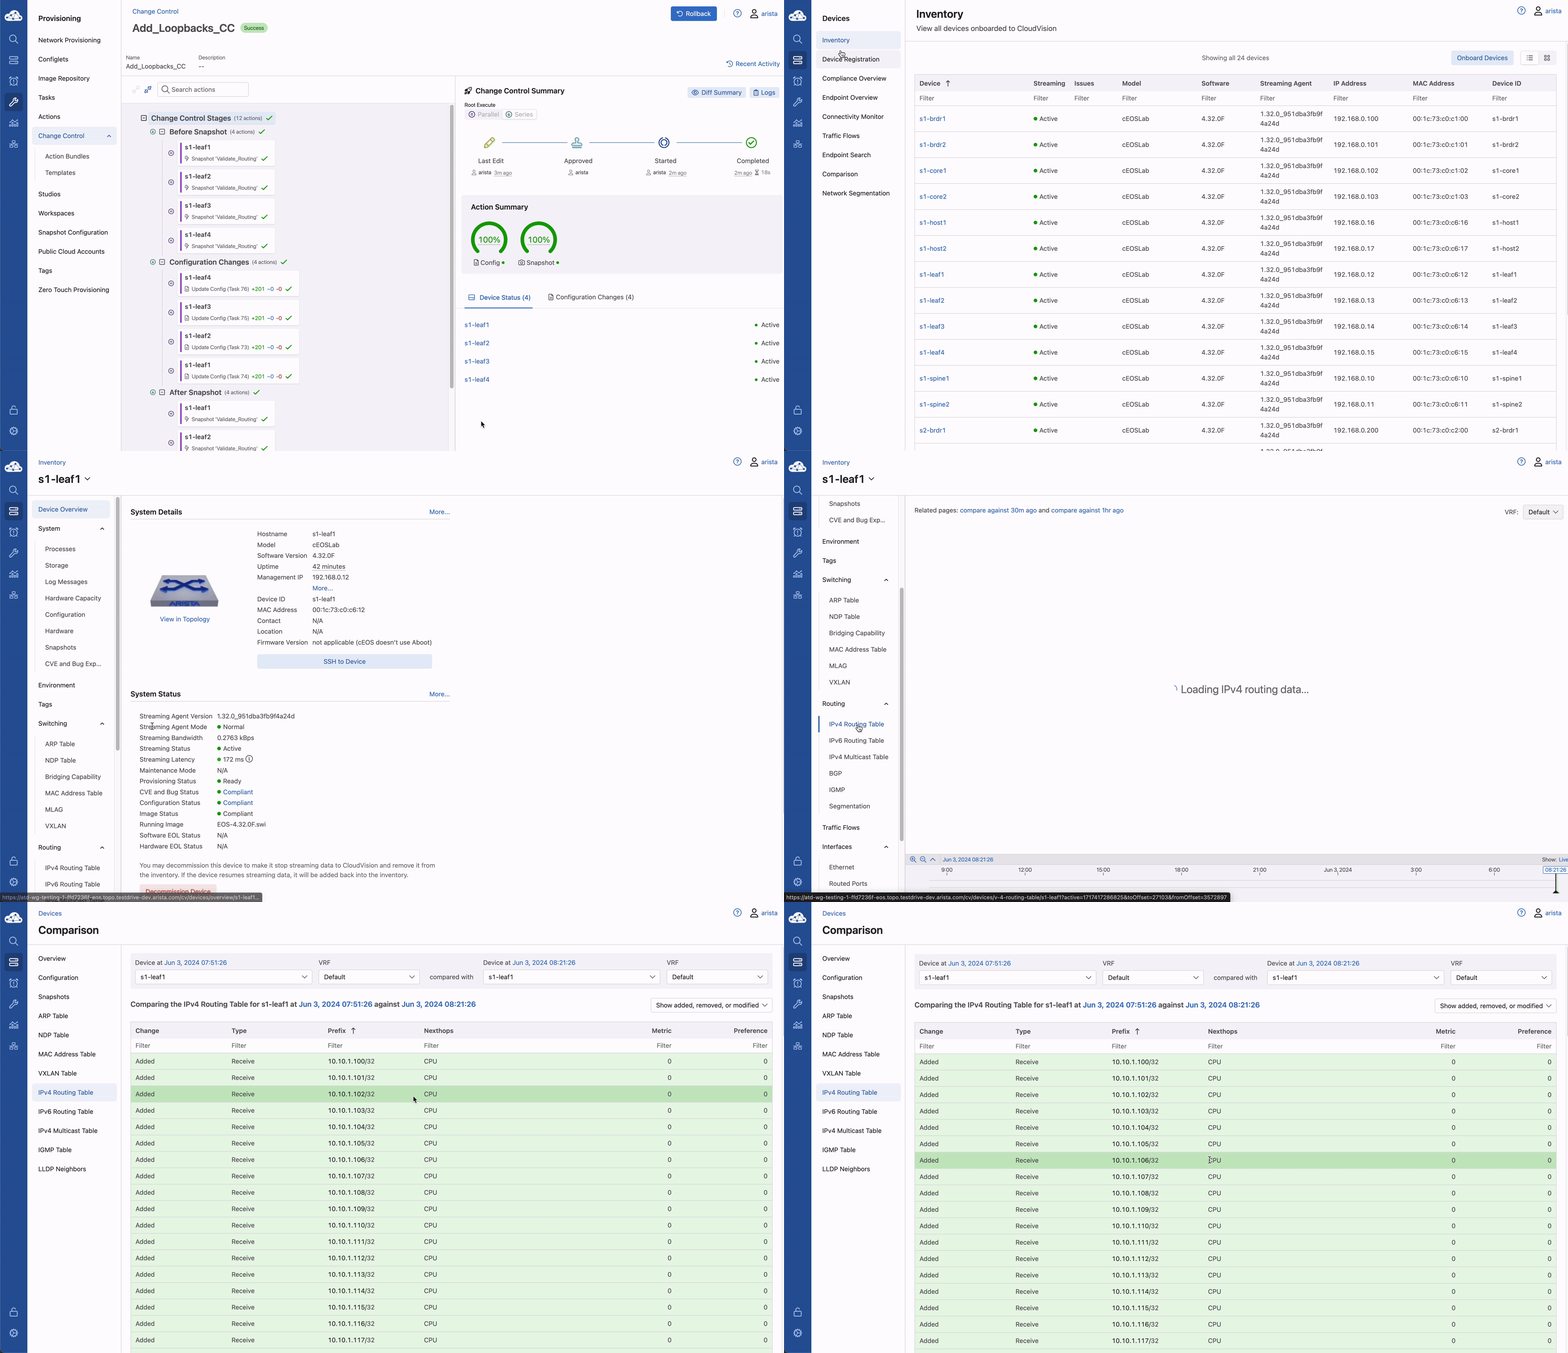
Using Telemetry, we can view the routes that were added as part of this change propagate across the environment. One way to view telemetry information is per device in the Devices tab.
-
Navigate to the Devices tab and select s1-leaf1 to view detailed information.
-
On the left Navigation column, select IPv4 Routing Table to see a live view of the device's routing table. Using the timeline at the bottom of the screen, you can navigate to any point in time to see what the route table was at that exact moment. You can also see a running list of changes to the routing table on the right.
-
By clicking on the compare against 30m ago link, you can navigate back to the Comparison view of the routing table to see all the routes added in green as part of the Change Control pushed earlier.
Creating a Dashboard
To view Telemetry information for multiple devices we can build a common dashboard.
-
Select Dashboard from the navigation menu.
-
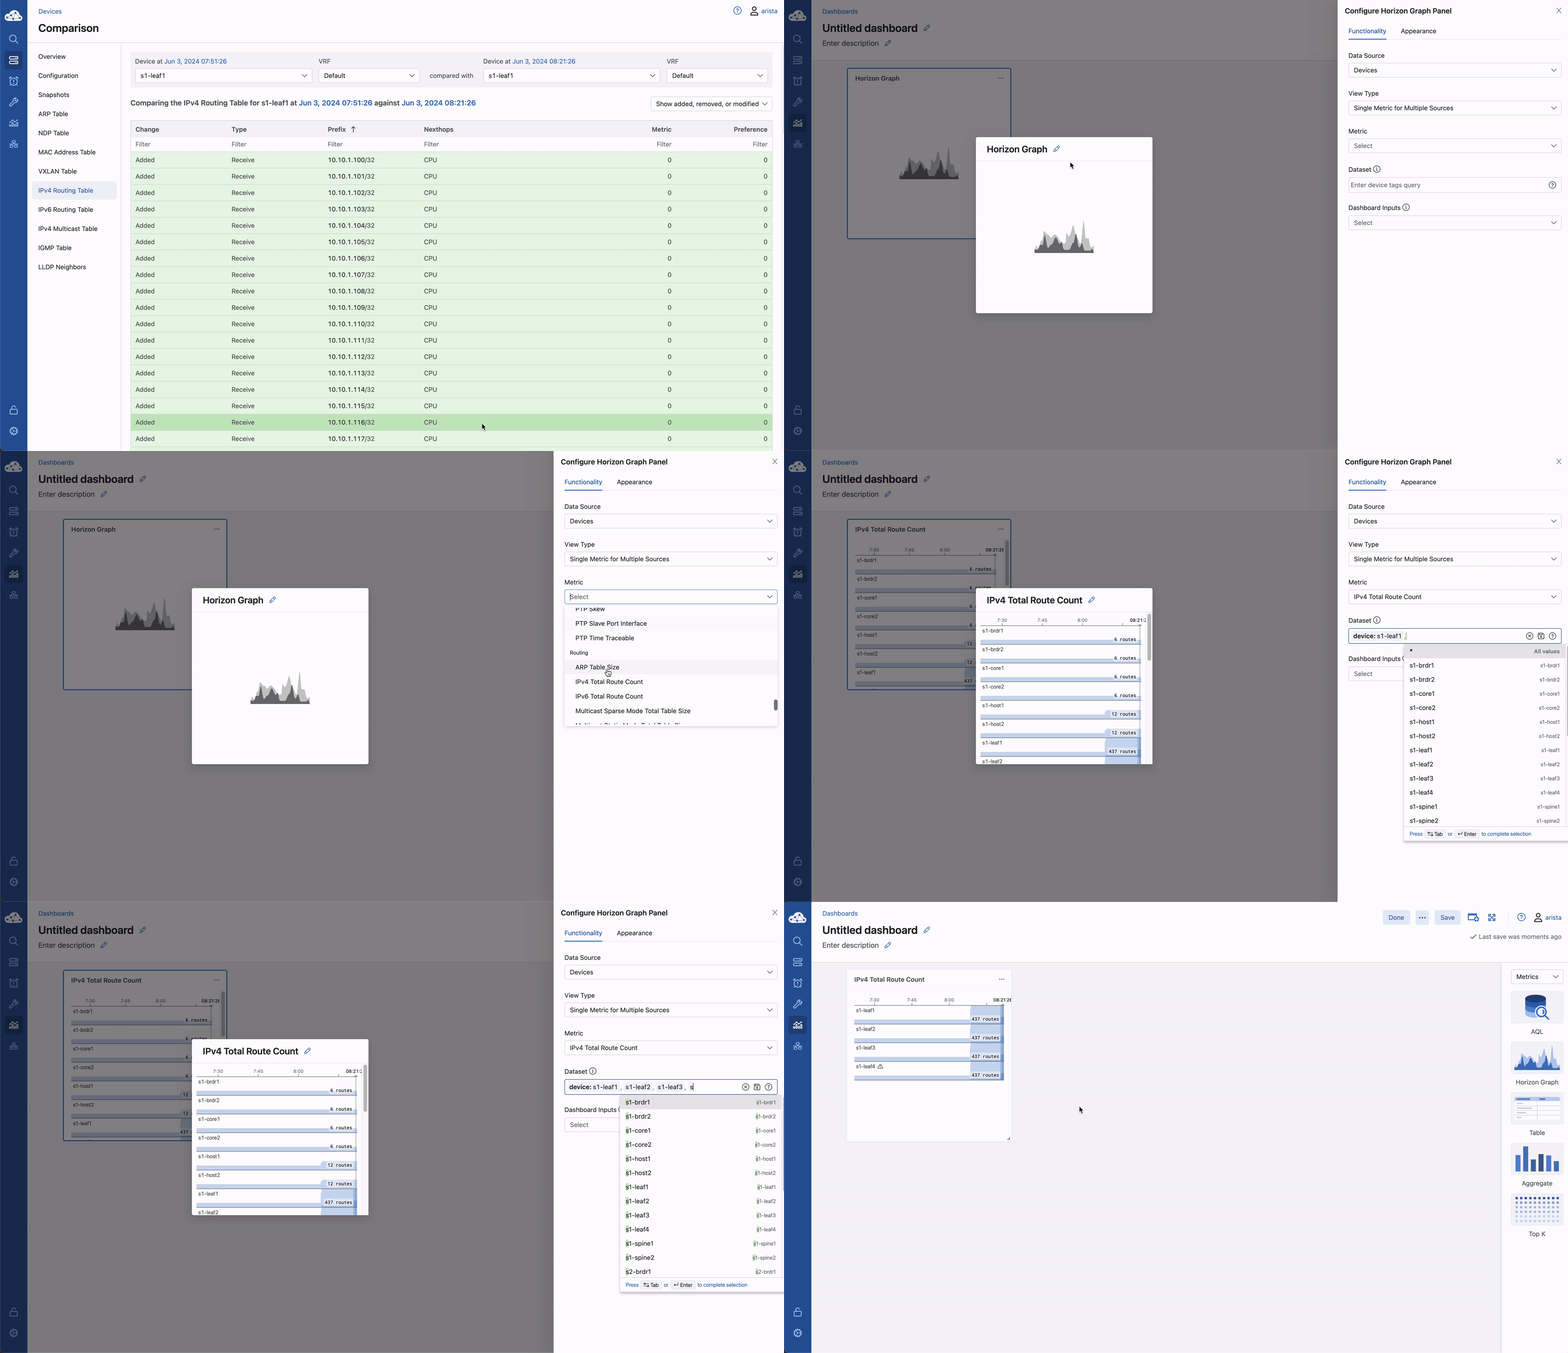
To build a dashboard, select + New Dashboard on the top right to bring up a list of available telemetry metrics to add. Drag the Horizon Graph to the middle pane, then click it to configure it.
-
Under the Metric dropdown, select IPv4 Total Route Count. In the Dataset box type device: S1-Leaf1, S1-Leaf2, S1-Leaf3, S1-Leaf4 to add them to the dashboard view.
-
This will bring up a live rolling view of the selected metric. In the timeline at the bottom, select 'Show Last: 1h' to view metric data for the last hour. You will see a graphical representation of the increase in routes for each device. (you may need to click the time near your dashboard name to get the timeline to show up)
-
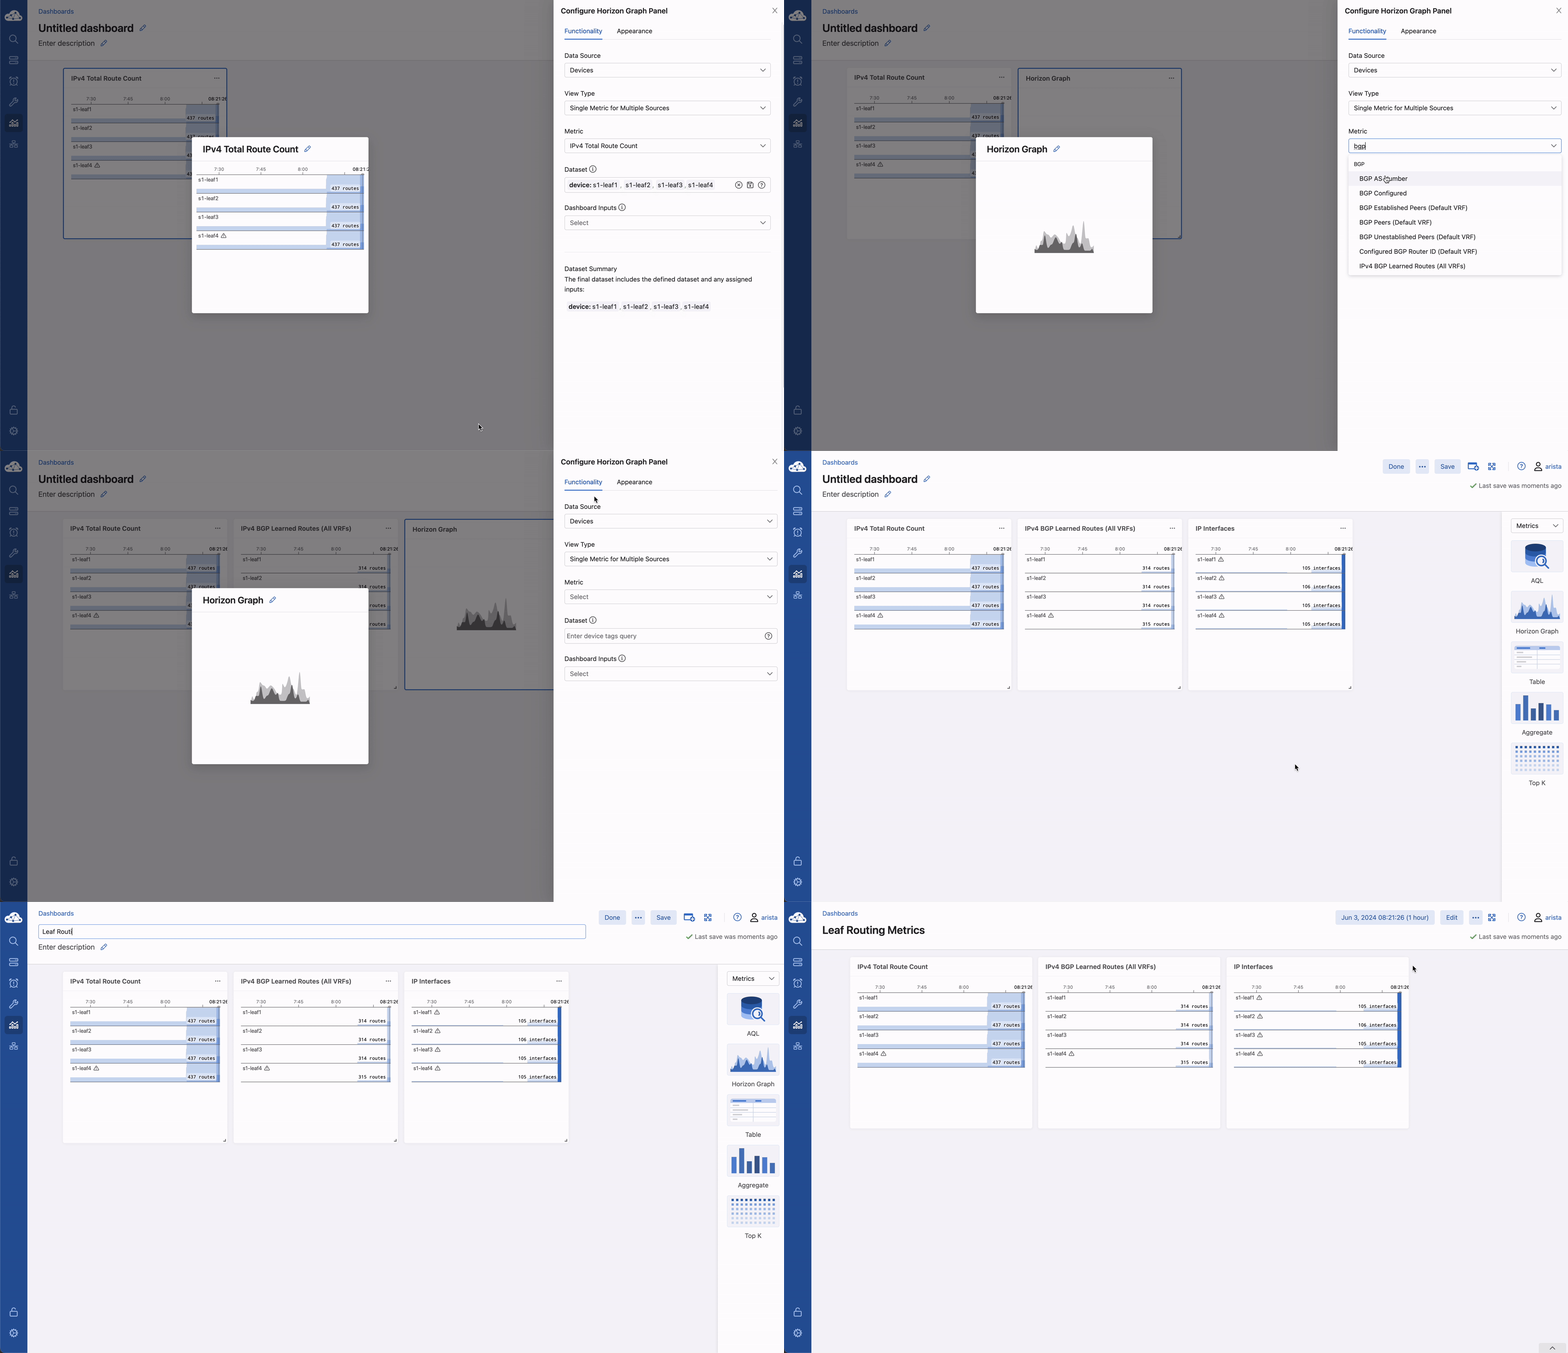
Using the same process, add a view for IPv4 BGP Learned Routes (All VRFs) and IP Interfaces to see other results of the Change Control. Then select the Save button in the top right.
-
Name the dashboard Leaf Routing Metrics, select Save, then select Done. The dashboard is now saved and can be pulled up by other users of CVP at any time to view the consolidated metrics selected.
Monitoring Changes After a Rollback
Just as we did in the Configlet lab, we can initiate a Network Rollback to revert the changes that were implemented. We can monitor the changes from our new Dashboard.
-
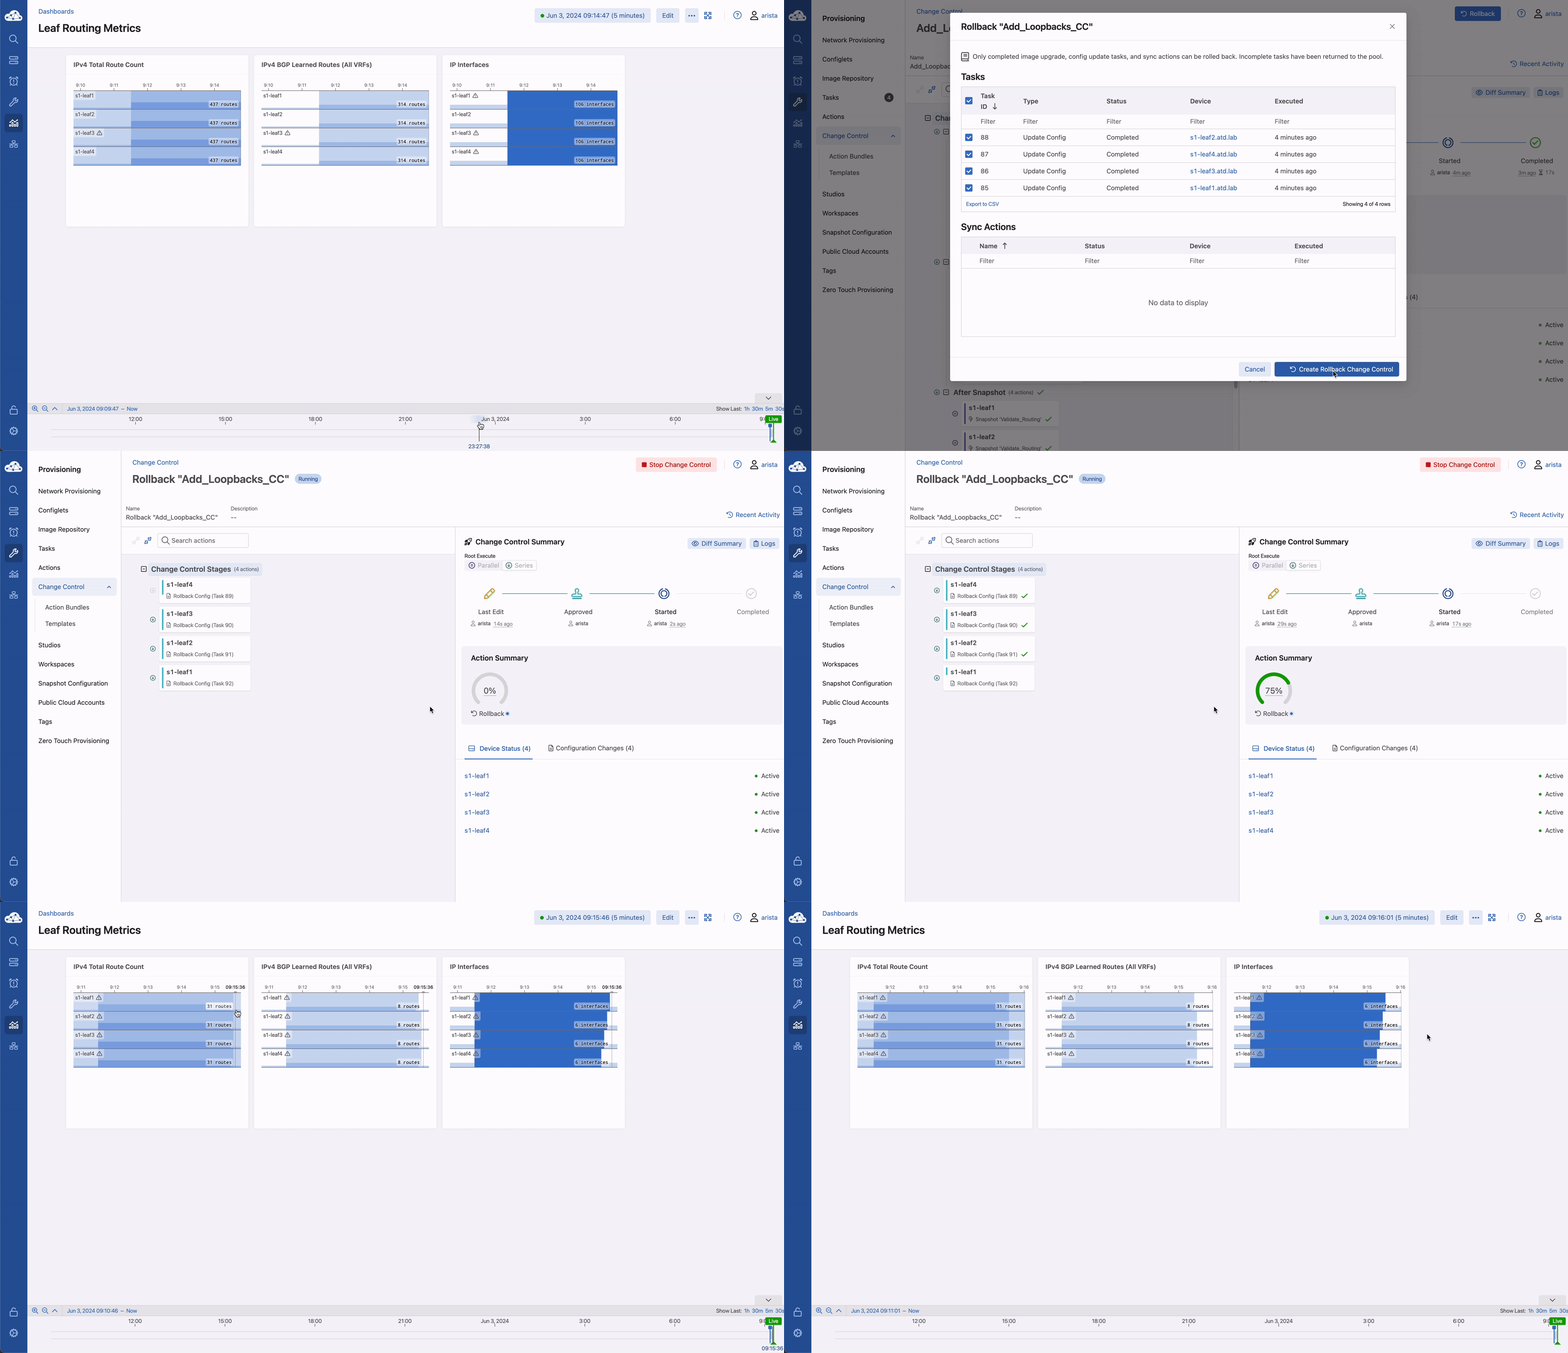
Go to the Provisioning -> Change Control page and find the change control we just executed: 'Add_Loopbacks_CC'.
-
In the top right, select Rollback.
-
Here we will select the tasks we wish to roll back. Select all of the tasks for the leafs and click Create Rollback Change Control.
-
We will now have a rollback change control created. The same change control process can be followed as before. Select Review and Approve to see a reflection of the changes that will be executed. Note that the config lines are now red as they will be removed when the Rollback Change is pushed. Select Approve to move to the next step.
-
Select Execute Change Control to push the change to rollback the configuration of the devices to the previous state.
-
Navigate back to Dashboards then the Leaf Routing Metrics dashboard. Select Show Last: 5m in the timeline to see your telemetry reflect in real-time the removal of the IPv4 routes and interfaces.
Success
Lab Complete!


