ATD Lab Access
Overview
Welcome to the Arista ATD (1) Lab Environment. While there are several different ATD topologies that can be deployed, the ways to access various parts of the lab remain the same throughout. This guide will cover the different sections of the lab environment, as well as how to access the devices in the topology.
- Did you know ATD stands for Arista Test Drive?
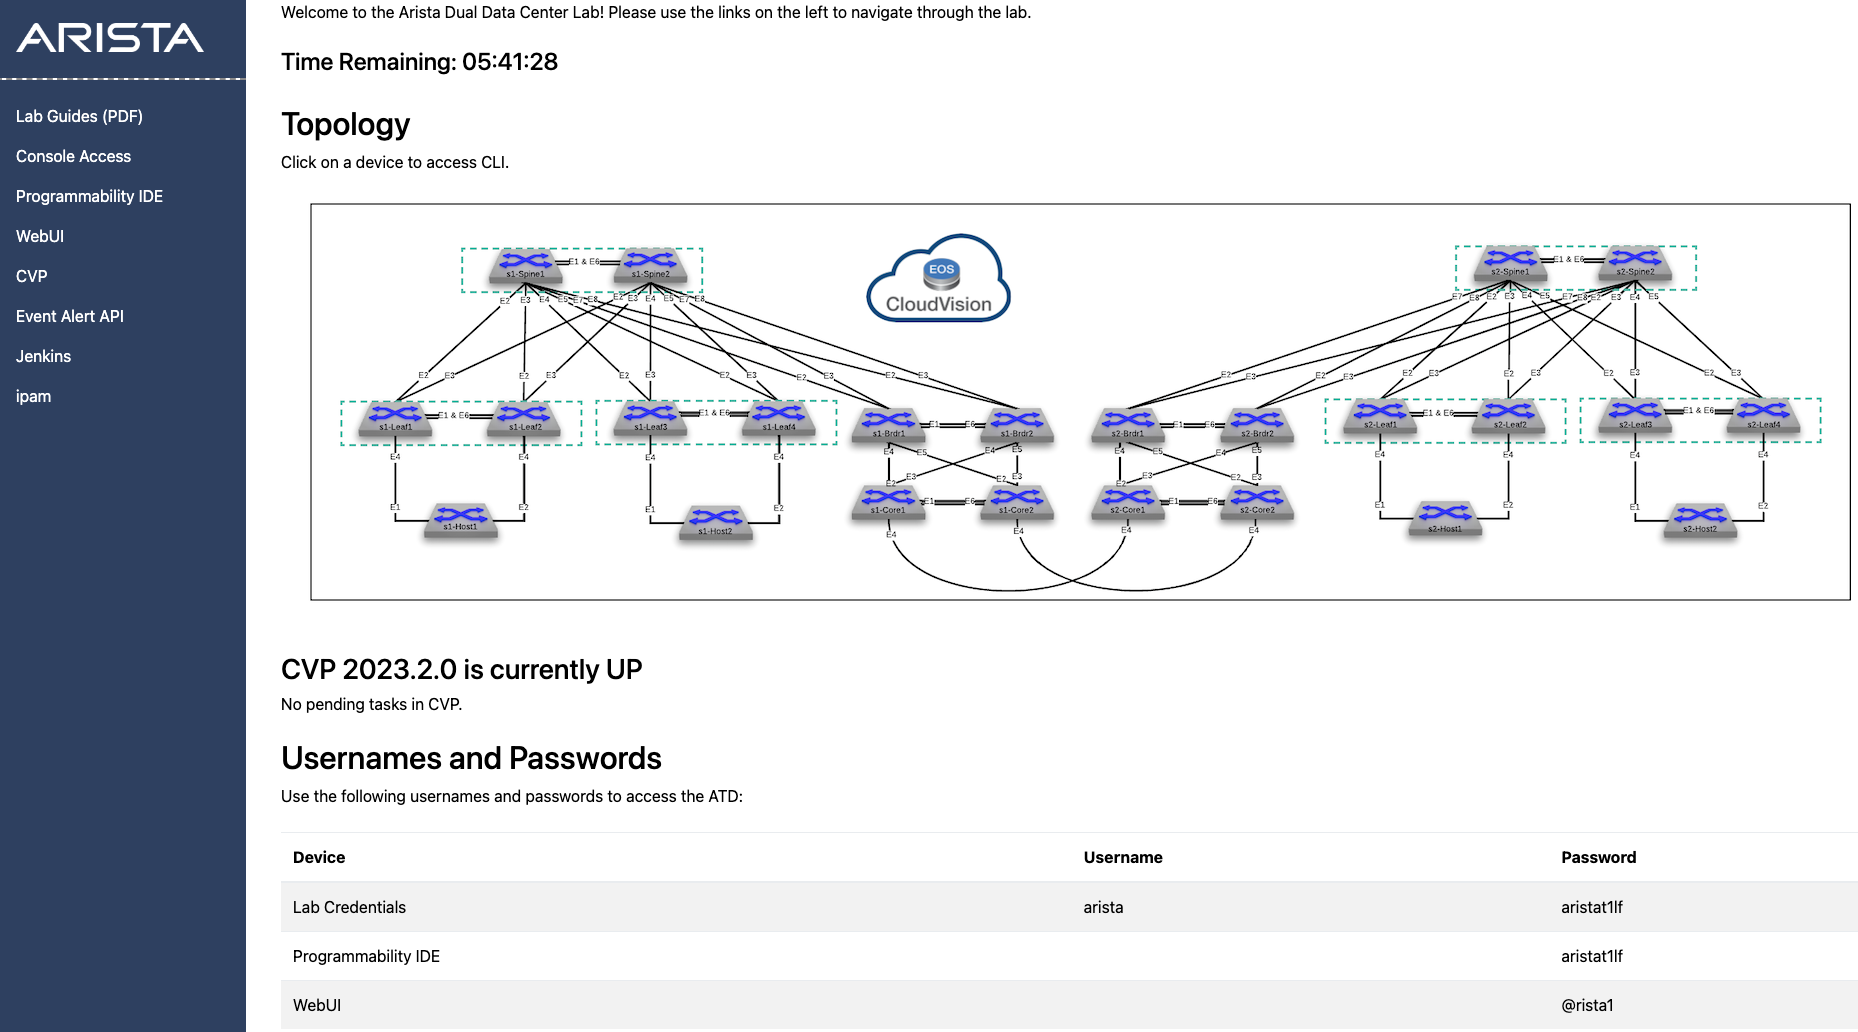
This screen is what you will see as the main ATD screen. It contains a menu of different items on the left, as well as the main section, which we will cover first.
Dual Data Center Topology
This topology image is for the Dual Data Center. You can see the other topologies available in the Campus Topology and Advanced Routing Topology sections in the left menu.
Starting at the top you will notice a Time Remaining clock counting down:
Every ATD lab instance will only run for a certain amount of time before shutting down and needing to be restarted. The typical default and maximum time is 8 hours.
Time Management
Keep an eye on this clock so you don't lose any work when the lab instance shuts down.
Moving down, you will see the actual network diagram that is a layout of the topology:
This is the actual layout of the lab you are working in. It is also interactive, meaning you can click on any device in the diagram to log in to it.
Below that you will see the CVP status indicator:
This will tell you the CVP version you have deployed in the lab, as well as if it is currently up or starting.
CVP Start Time
Sometimes the virtual CVP instance in the lab can take upwards of 20 minutes to start. Patience is a virtue.
The last section of the main overview is the Usernames and Passwords section:
This contains all the credentials you would need to log in to the various devices and services in the ATD lab environment and are broken down as follows:
Lab Credentials: Used for all switches, CVP, Jenkins, and ipam
Programmability IDE: Used for the Programmability IDE (1)
- In the ATD lab environment, the Programmability IDE is a virtual VS Code instance.
WebUI: This is used for the WebUI login.
Moving on to the left menu list we will cover the services available in the lab environment.
Console Access
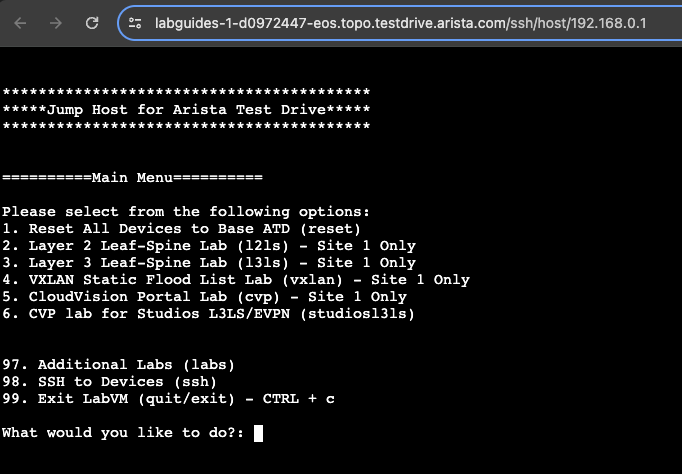
The first option in the access menu is for Console Access. Clicking this will open a shell based console server with some options.
The menu options are several levels deep, and each respective lab will have instructions on how to load or reset the lab.
Programmability IDE
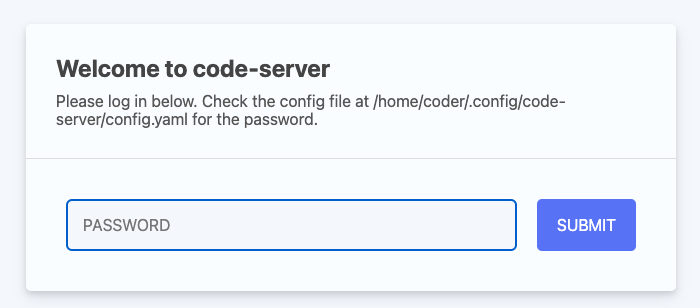
Next in the list is the Programmability IDE. This is a virtual instance of VS Code. By clicking on the link, you will then be shown a login prompt:
Here you will enter the Programmability IDE password.
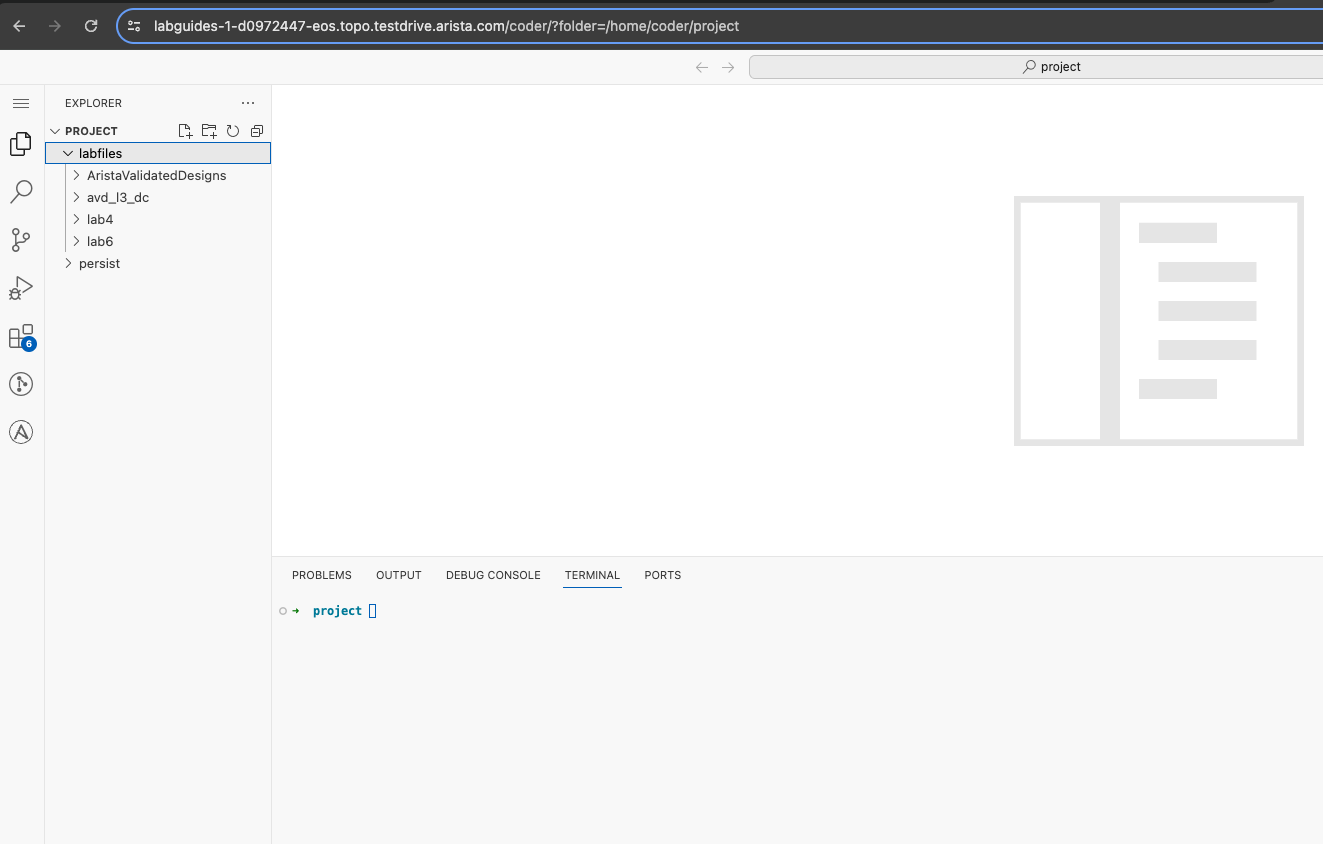
Once entered, the virtual VS Code instance will load and look like this:
WebUI
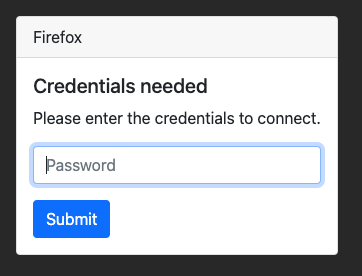
Next is the WebUI. The WebUI is a virtual Firefox instance that you can use to access the eAPI of the lab switches. Clicking the link will prompt you with the following login window:
Here you will enter the WebUI password.
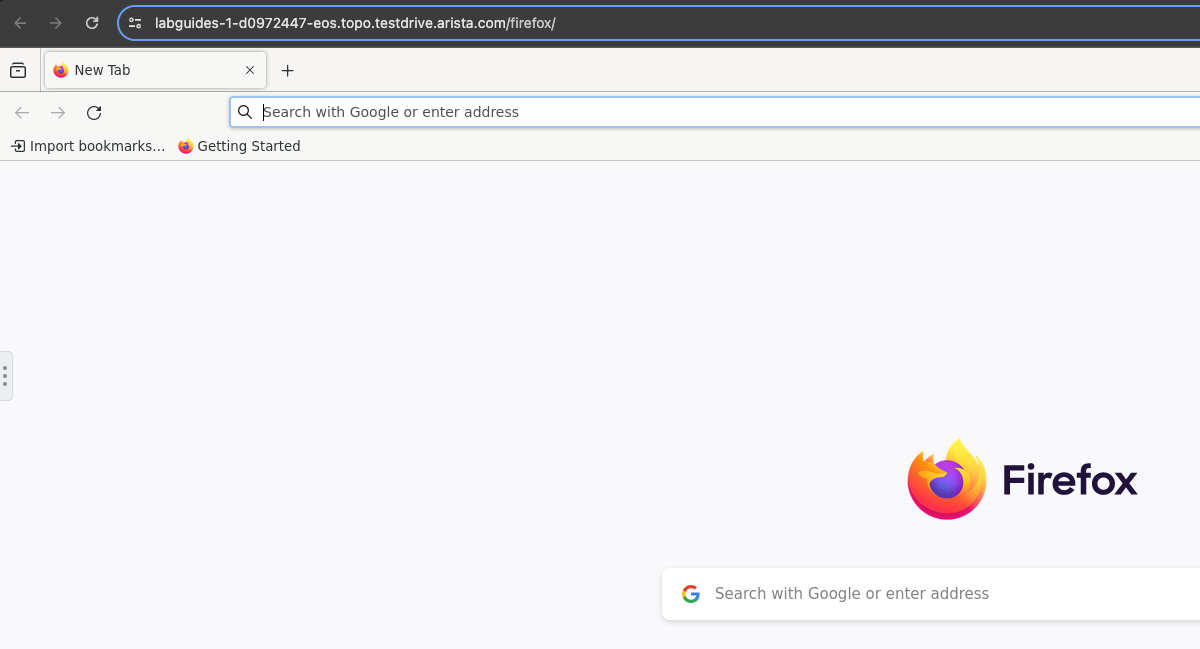
Once entered, the virtual Firefox instance will load and look like this:
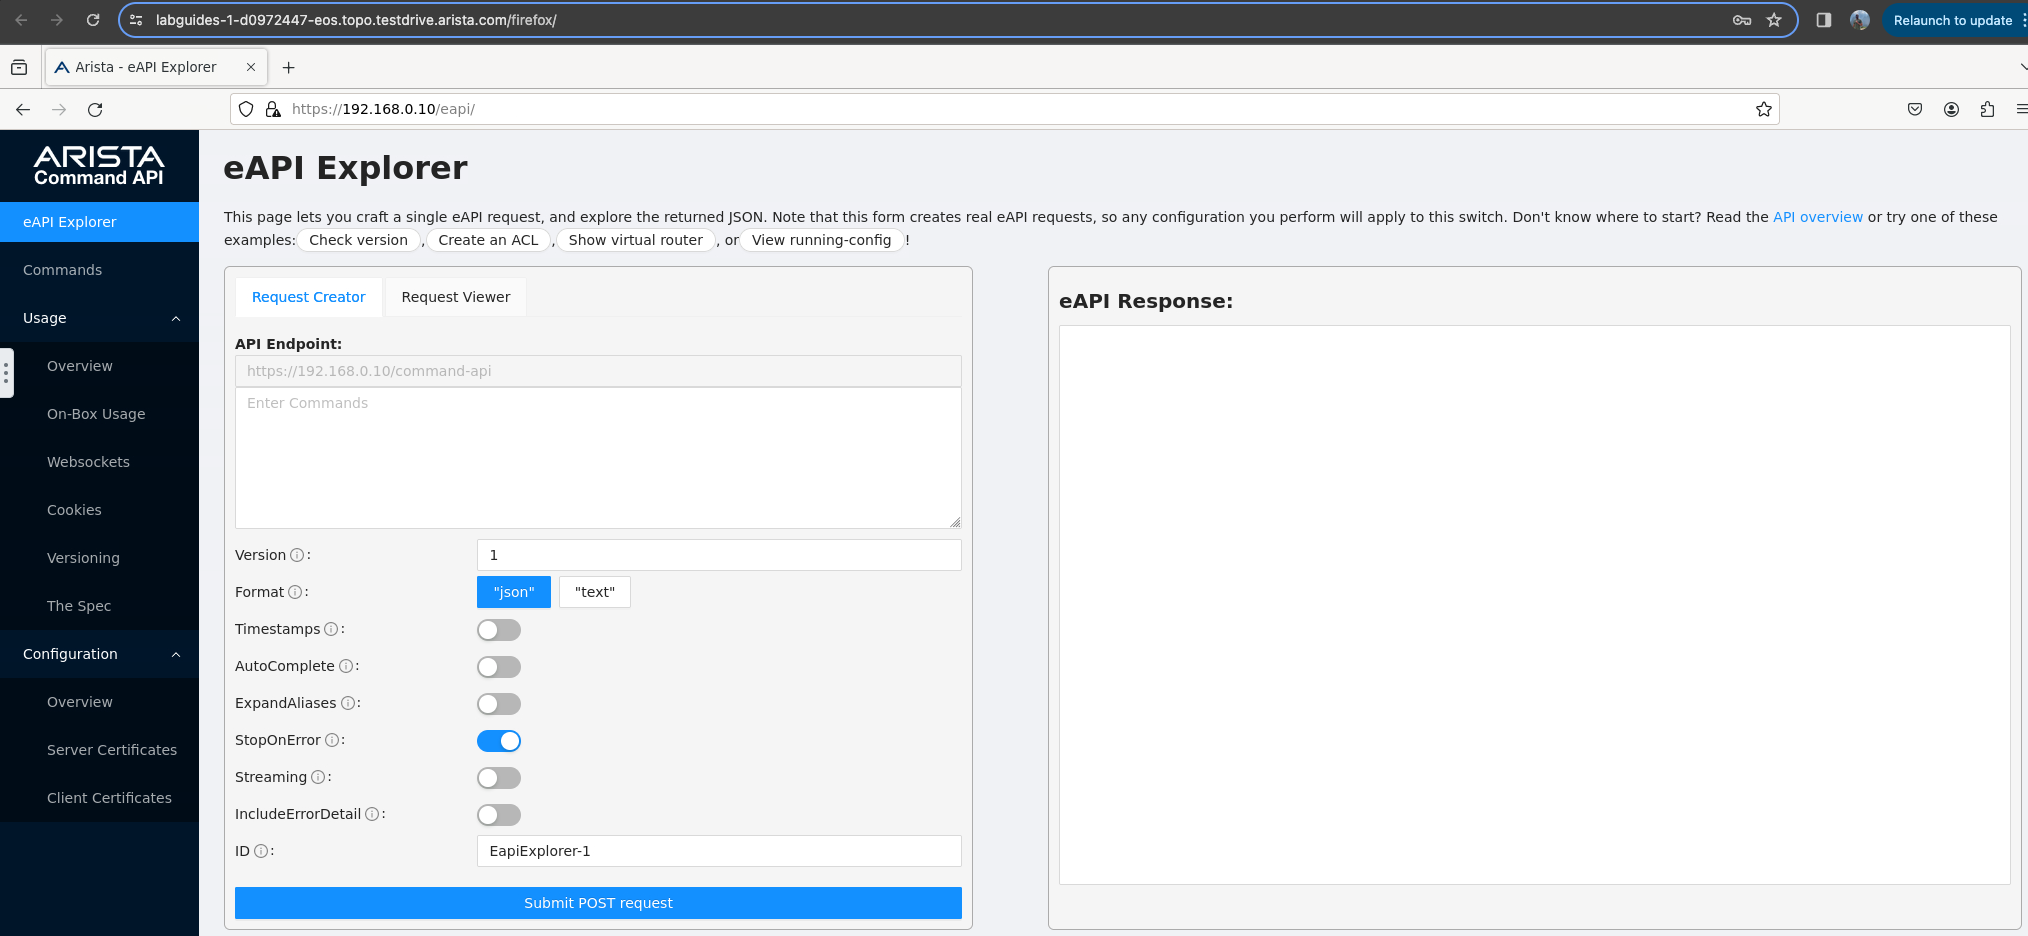
You can access the eAPI of any switch in the topology by entering https://[device mgmt IP] in the browser:
CVP
The CVP link will open the lab instance of CVP. Additionally, you can open CVP by clicking the CloudVision icon in the Topology network diagram. Upon clicking, a new window will open with the CVP login page:
Here you will enter the Lab Credentials username and password.
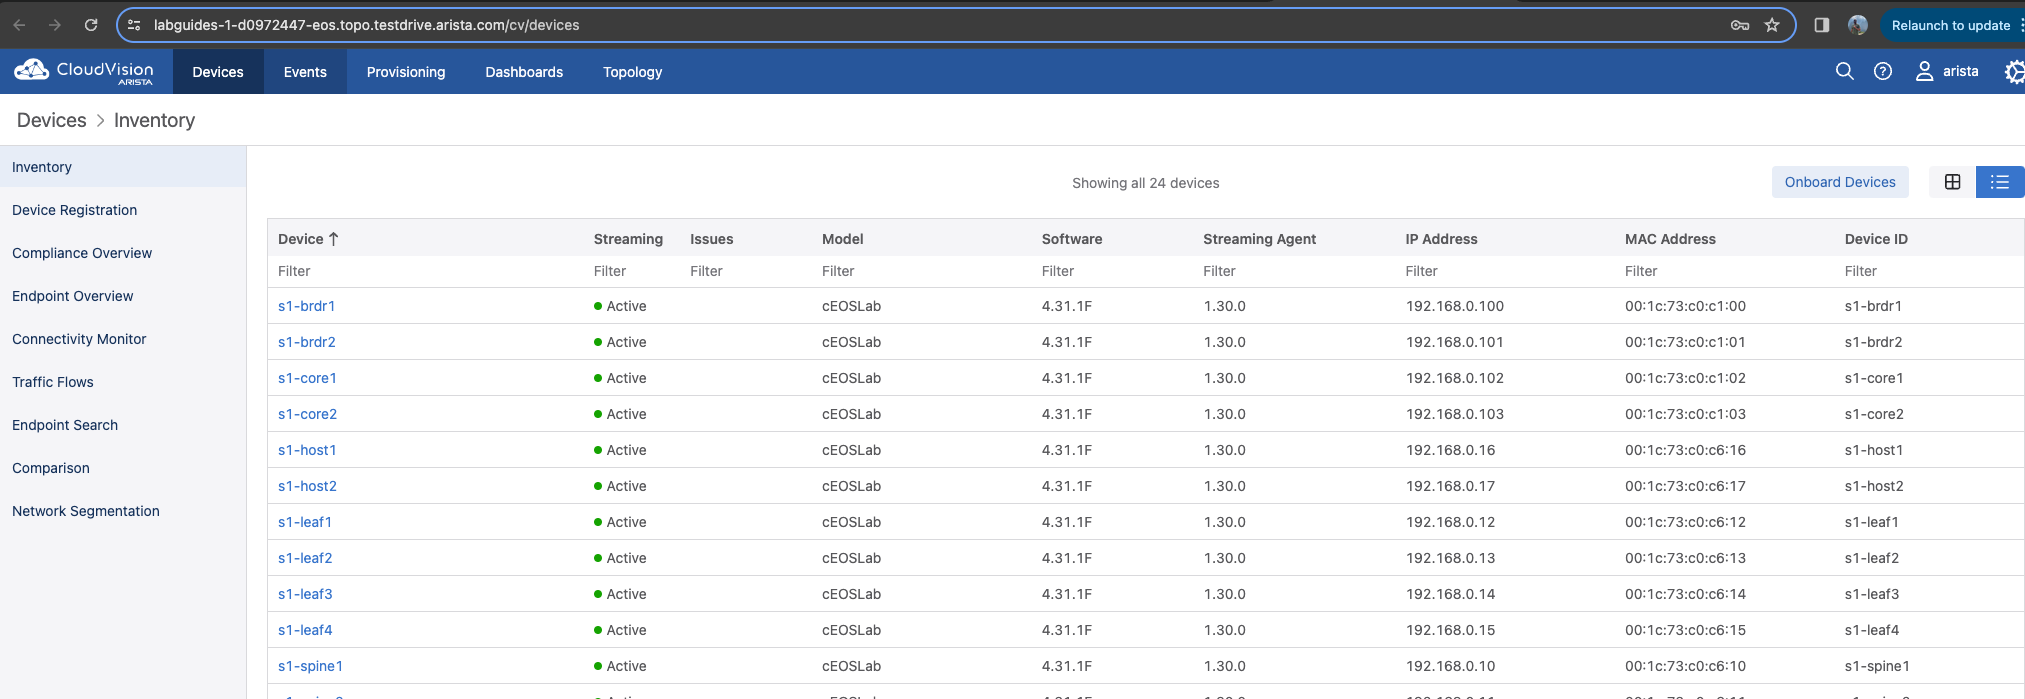
After authenticating, the CVP Devices -> Inventory page will load:
Event Alert API
Event Alert shows any alerts that may be reported by CVP in an easier to read format. Typically there won't be any alerts, but clicking the link will show you:
Jenkins
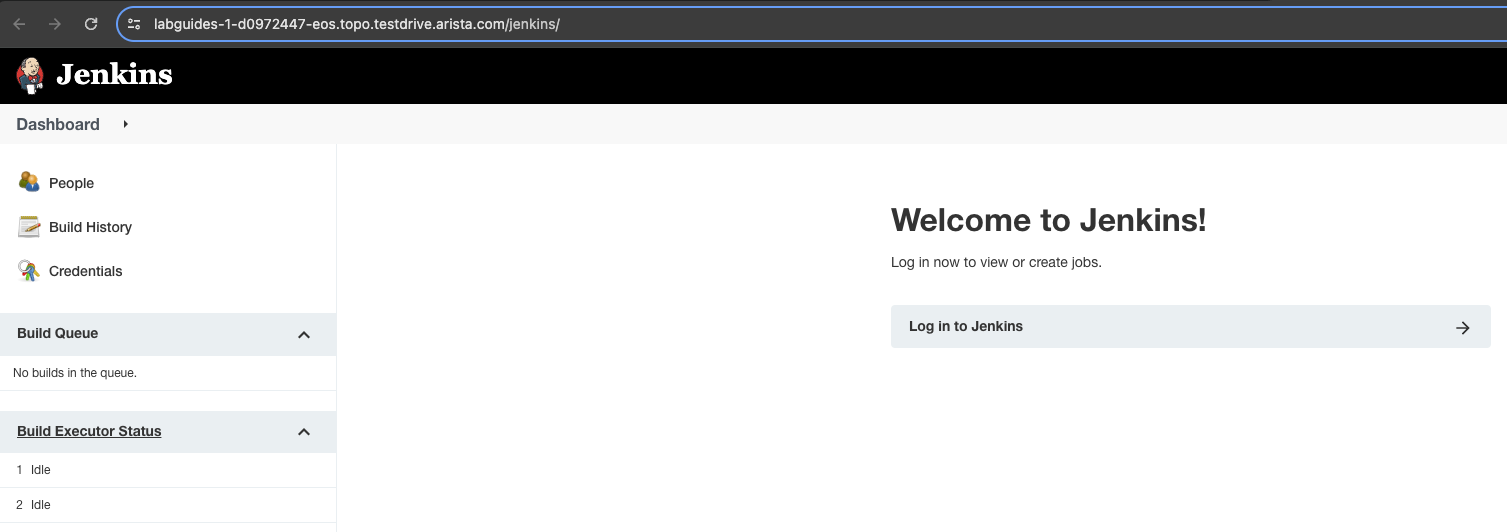
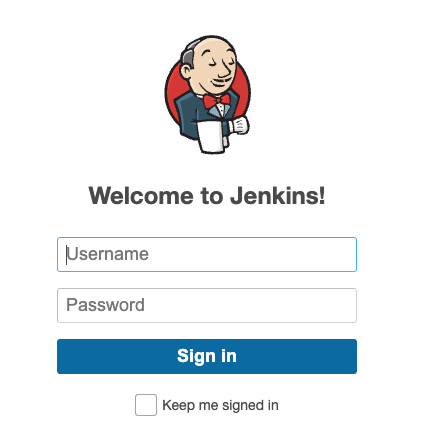
The Jenkins link will launch a virtual instance of the Jenkins automation platform. When you click it you will see the main Jenkins page, but will need to log in by clicking the Login to Jenkins banner:
Here you will enter the Lab Credentials username and password.
After authenticating it will take you back to the Jenkins main page.
ipam
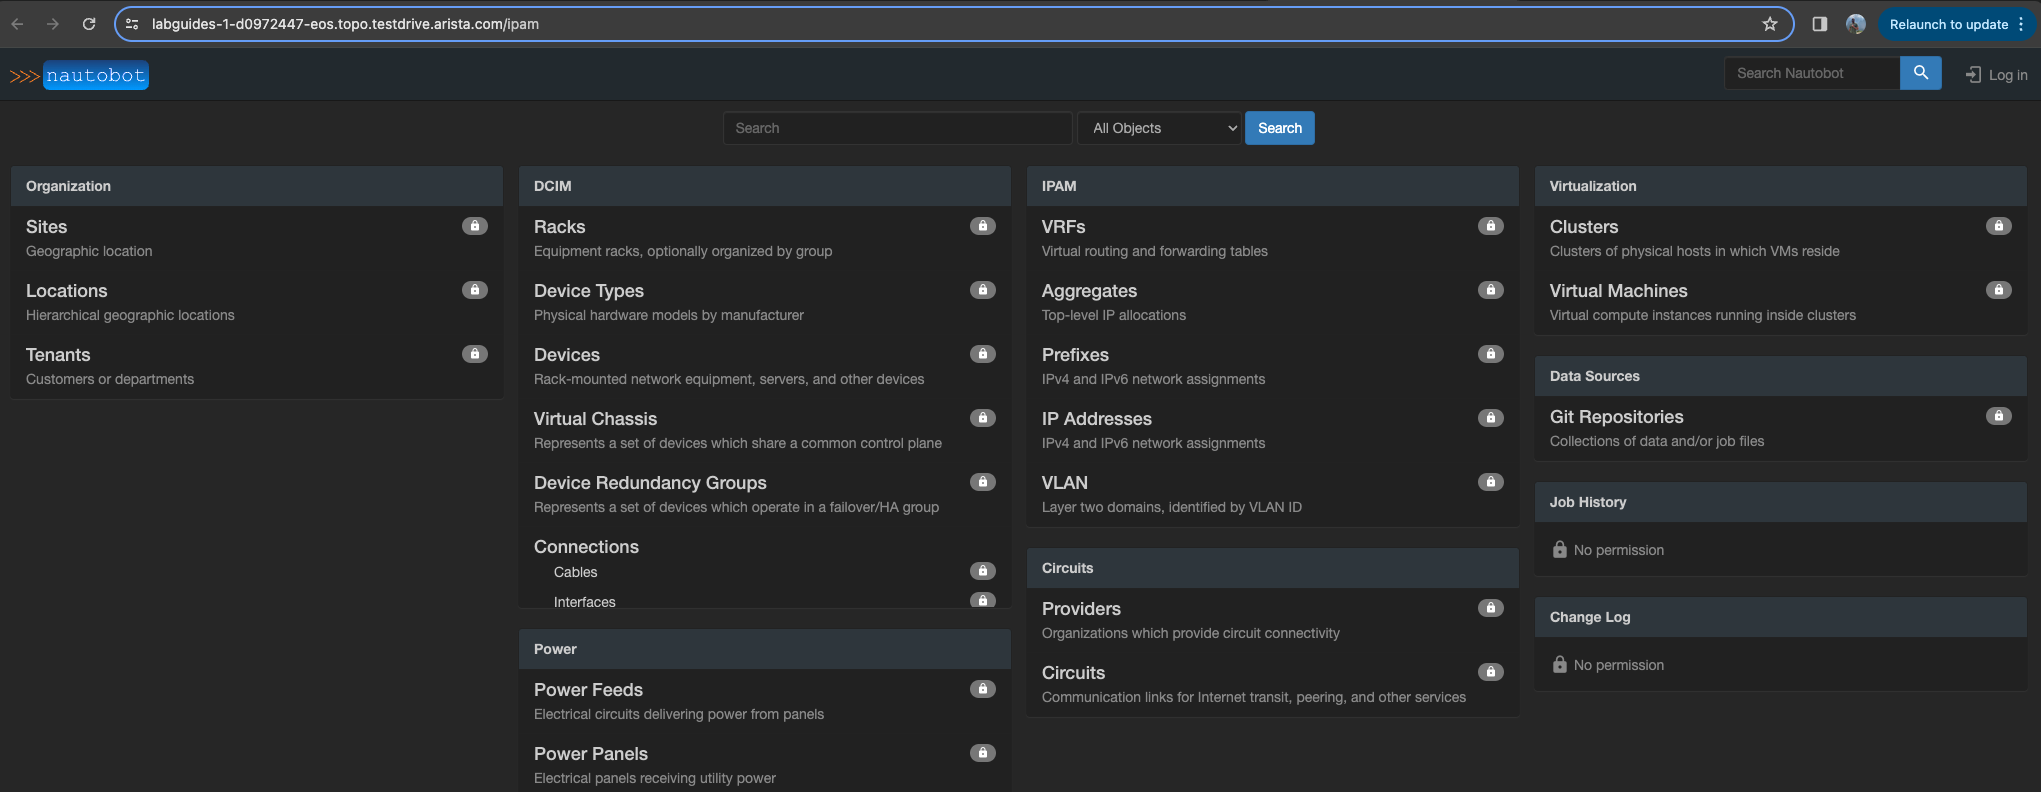
The final link, for ipam, will launch a virtual Nautobot instance. The link will load the main page of Nautobot:
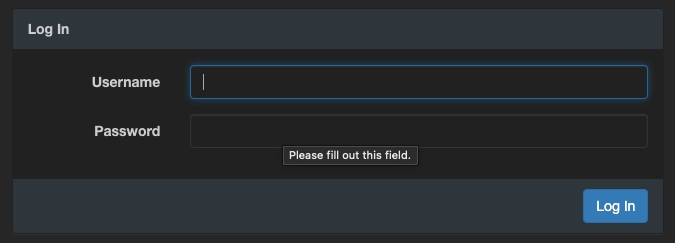
Clicking the top right Log In button will prompt you to Log In:
After authenticating it will take you back to the Nautobot main page.
Overview Complete
Happy Labbing! Any questions, contact your Arista SE.
